The BTR Database
Q1. 2024.
Franklin St. undertakes detailed tracking of publicly available information of BTR projects throughout Australia. The Franklin St. BTR Database – Q1 2024 includes all completed, under construction and proposed/announced projects. This information can now be accessed via the Franklin St. BTR Map.
Outlined below are the key insights Franklin St. have derived from the BTR landscape in Australia.
– Total BTR Pipeline: 51,947 units across 144 projects.
– Operating BTR Units: 5,398 units. 4,827 units due to complete in 2024 (10,225 total by end of 2024).
– Investment Platforms: 22 BTR Platforms with projects complete or under construction.
– BTR Market Breakdown:
- Operating Assets: 20 (5,398 units).
- Under Construction: 31; (11,582 units).
- Permitted: 35 (11,283 units).
- In planning: 54 (21,627 units).
- Proposed: 4 (2,057).
– Market Value: $39bn (assumed completion value of current pipeline).
Current State of Play.
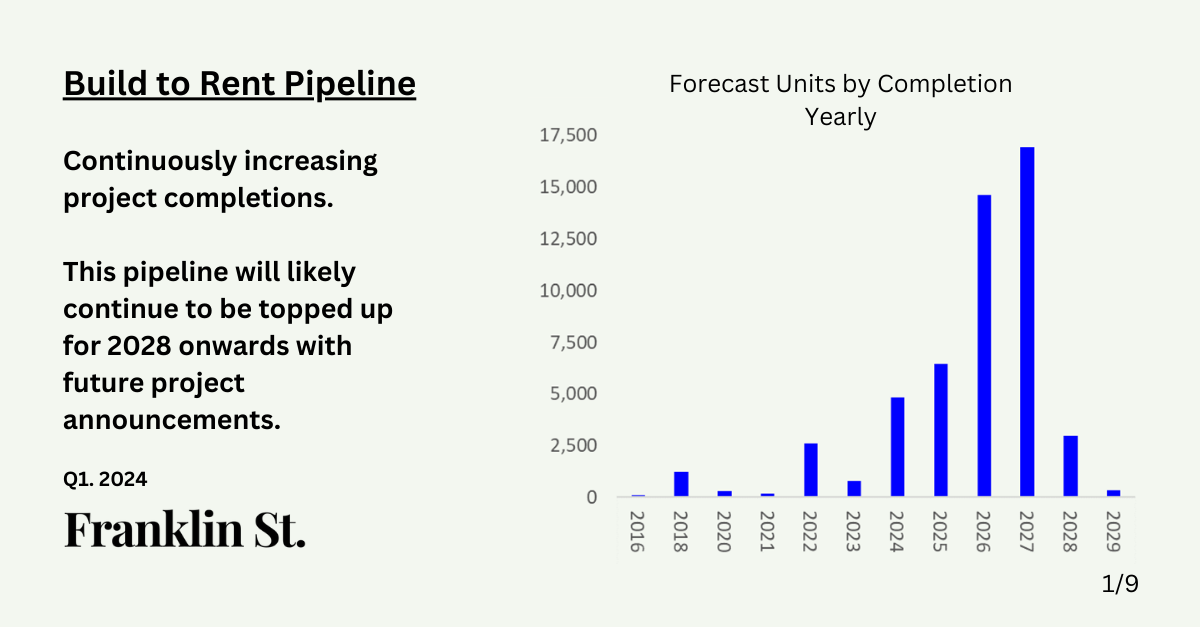
Build to Rent has consistently evolved over the past 5 years. The first purpose-built projects opened their doors in 2022 consisting of 9 buildings containing 2,602 units. In 2023, 7 projects completed construction and entered the operational phase, adding 941 units to the rental pool.
As can be seen in Chart 2 (in the below slider), only 10% of all units (14% of all projects) are operational.
The majority of Australia’s BTR pipeline (61% of units | 65% of projects) is yet to receive a permit.
2024 Outlook.
The Australian BTR market is heading into 2024 with 31 projects under construction, totalling 11,582 units.
In 2024, the market will nearly double in operating scale, which is the largest annual increase to date. With 15 projects totalling 4,827 units coming online. By year-end Franklin St. anticipate 10,225 BTR units to be operating across 35 projects.
The significant increase in the depth of comparable BTR rental evidence will help boost confidence in asset analysis. Further, increased market depth and clarity will add support to asset valuation and allow for increased investor demand.
Beyond 2024.
Looking further ahead, the pipeline of proposed completions quickly becomes exponential. Assuming projects continue to progress from concept through permitting and construction, the Franklin St. BTR Database forecasts the potential for 48,645 operational units by the end of 2027. This is almost a doubling of operational units, every year.
The market is keenly waiting to see how this pipeline progresses. Just as importantly, how will this pipeline grow with the announcement of further projects to deliver in 2028 and beyond. There has also been the recent launch of Housing Australia’s HAFF and NAHF support. Will the exponential growth continue like it has in the UK BTR market?
However… Announced Does Not Mean Funded.
Naming projects as Build to Rent is one thing. Proceeding to secure institutional investment to commence construction is proving to be another.
Of the nearly 52,000 units in the pipeline/BTR Database, not all of these are funded as of today.
Franklin St. analysis shows that only 59% of all units (63% of projects) in this database 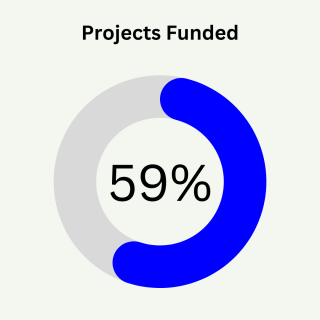 are currently considered funded, and therefore able to commence. This represents a market closer to 30,000 apartments nationally.
Naturally, as projects progress through the planning journey, projects become increasingly de-risked and fundable by institutional investors. However, Franklin St. is of the view that a significant portion of the announced projects do not meet the various requirements of a BTR project, especially through an institutional lens. These requirements include design, scale, unit mix, returns, risk structures, location, developer partners or a combination of multiple factors.
The hurdles for BTR to secure funding are significantly higher than those for BTS. This is due to a number of factors, including:
- BTS projects have typically secured a certain level of pre-sales prior to seeking construction funding, de-risking the investment profile for debt and equity.
- BTR investors are typically more institutional in nature as opposed to private, or high-net-worth or family office investors. These institutional investors typically require tighter due diligence and focus on risk. They may include both local and global investment committee approvals before funds are invested.
Taking this all into account, there is a significant gap between announcing a BTR project and actually securing investment and starting construction.
A significant number of announced projects in the Database may not deliver as or when proposed.
With 41% of the BTR Database potentially unfunded, Australia’s housing supply issue looks even tighter than previously reported.
Build to Rent Themes Occurring:
1. Melbourne is the Build to Rent Heartland.
Alongside its recently attained status as Austrlia’s largest city, Melbourne currently represents 51% of all BTR projects announced and operating. This is also evident in the Franklin St. BTR Map.
Melbourne has benefitted from availability of land, lower land prices and a somewhat more streamlined planning process. BTR developers in Melbourne have been able to acquire sites and produce scale which to date, has been unattainable in Sydney.
Melbourne has flourished in the Docklands with 4,365 units proposed for Build to Rent. However, only two projects are under construction representing 1,473 units. These projects are Home & Lendlease Melbourne Quarter with Daiwa House.
Following Docklands in the Victorian capital; Southbank (2,442 units), Melbourne (2,003 units), South Melbourne (1,858 units) and Kensington (1,286 units) round out the top 5 in Melbourne, each of which are also in the top 10 suburbs nationally.
Nationally, there are 5 remaining suburbs in the top 10 by number of pipeline units. These are; Fortitude Valley (2,685 units), Parramatta (2,162 units), Macquarie Park (1,734), Woolloongabba (1,709 units) & finally Southport (1,251 units).
2. But Sydney is catching up!
Melbourne was able to get a head start on the rest of the nation due to strong demand metrics combined with cheaper land and construction metrics. Sydney is quickly catching up.
As is shown in the delivery pipeline & BTR Map, multiple projects have been announced in Sydney to deliver into 2026 and 2027.
Melbourne has seen the majority of BTR projects located within 5km’s of the CBD. Sydney however, has seen significant activity along major public transport routes further from the CBD. Sydney has also created a significant pipeline in satellite cities such as Parramatta and Penrith.
3. Whilst QLD has lots of announcements…. not many have started construction.
The demand for rental product in Queensland remains incredibly strong driven by strong population growth. However, the cost of construction and availability of builders continues to stall the best efforts of investors and developers to commence construction.
- Queensland currently makes up 35% of completed units nationally (of which 23% of this is located in one project, Smith Collective).
- Conversely, Queensland only makes up 16% of all units currently under construction – proof of the challenging construction environment.
Time will tell if the current pipeline sticks to the delivery schedule outlined below, or if construction challenges continue to push projects out.
4. How big are BTR developments?
Analysis of the total BTR database shows that projects are averaging 361 units in size, with a median project size of 340 units.
Franklin St. analysis of the Database shows that each developer / operator has a clear mandate for the projects they own and manage.
Below is a sample of some of the major operator/developers in the market and their average project size.
- Mirvac Liv, 440 units (5 projects).
- Home, 435 units (7 projects).
- Greystar, 429 units. (6 projects).
- Lendlease, 575 units. (4 projects).
- Novus, 214 units. (5 projects).
- Pellicano, 113 units (8 projects)
5. BTR locations moving outward along the rail corridors.
The early projects and pipeline started adjacent to the CBD. This is where the highest rents were and large-scale projects could be developed. This is evolving for a number of reasons including market maturity, funding structures, differing requirements for scale, increased competition and emphasis on Key Worker & Affordable housing.
Projects are now having less focus on CBD adjacent suburbs, similar to how the market evolved in the UK. We are now seeing greater emphasis on well located sites along train lines. Looking at the Franklin St. Map, there are clear patterns and spines emerging with BTR density clustering in hubs around train stations.
Location, and designing/positioning of BTR assets for the target renter demographic will continue to be absolutely critical to the successful funding and operation of BTR projects.
6. Affordable Housing.
Recent evolution in the BTR space has seen significant focus placed on Key Worker, Affordable and Social Housing. This includes the implementation of a number of government funding arrangements supporting increased housing for the demographic and may see a more meaningful investment in the sector from Australian superannuation funds.
Key operators in this sector include:


Franklin St. Forecasts
Franklin St. is confident that the BTR Database will continue to evolve, and are forecasting the following trends could emerge:
Projects in Limbo
A significant number of projects in this database will remain in limbo, unfunded and effectively stalled for some time. These “Shadow Projects” are typically not purpose-designed or conceived BTR assets and institutional capital will continue to pass them over for investment in their current form.
For these Shadow Projects, it will likely take a project reset in the form of new design / operator / developer / target renter, or a combination of these factors to see them come to life.
Surge in Product
Due to overwhelming demand for new housing, which is transpiring into strong rent growth, new projects will continue to be added to this database.
Whilst Franklin St. believe there will be a tapering off of the exponential cumulative total units, it is well within the realms of possibility that there are soon over 100,000 BTR units in the Database to deliver by 2030.

Franklin St. BTR Capital & Advisory
Franklin St. is leading the way in bringing projects from concept through to capitalised and constructed.
With an extensive background in Australian and global Build to Rent projects, our mission is to introduce best practices from around the world to the Australian market. We have been instrumental in conceptualizing, funding, and delivering landmark projects across Australia, the US, and the UK.
For further research & insights, follow us on Linkedin or read about the Franklin St. take on Build to Rent in Australia at The BTR Equation.